could someone explain to me the mechanics of this implementation and why you think NI went for it?
Answer from DDMF (PluginDoctor)
""""" 'Plugindoctor is aware of the latency that is reported by plugins, and is
correcting for it in its phase display (not in the impulse response
display as I think it can be interesting to actually see the delayed
impulse response). ....
..... So all the phase response that you see is "real", i.e. it is either a
result of whatever filters are present in Reaktor, or the reported
latency by Reaktor is wrong (already one sample can lead to a visible
change in the phase response)......""""""
I uploaded the delays to fix this
https://www.native-instruments.com/en/reaktor-community/reaktor-user-library/entry/show/14419/
are you talking about this? is it linear phase? i'd often wondered if there were built in filters for the eventual downsampling back to base sample rate for output, but never looked into it
actually, its more common to use custom oversampling within core itself as multiple instances of a process running at regular sample rate, that way you can use whatever kind of filters you want
if you search for oversampling in the user library, you will find a veritable goldmine
Hey Andrew, thanks for your answer. "This" either in factorial or fixed mode, displays the characteristics of Linear phase oversampling (ie pre-ring and also a tiny latency). however it warps the phase very much the same way minimum phase oversampling does, like for example most library solutions you referred to. it certainly is not clean Linear-Phase oversampling. here's some graphs>
in-out 1x impulse:
This is rougly what a lowpass impulse looks like 1x:
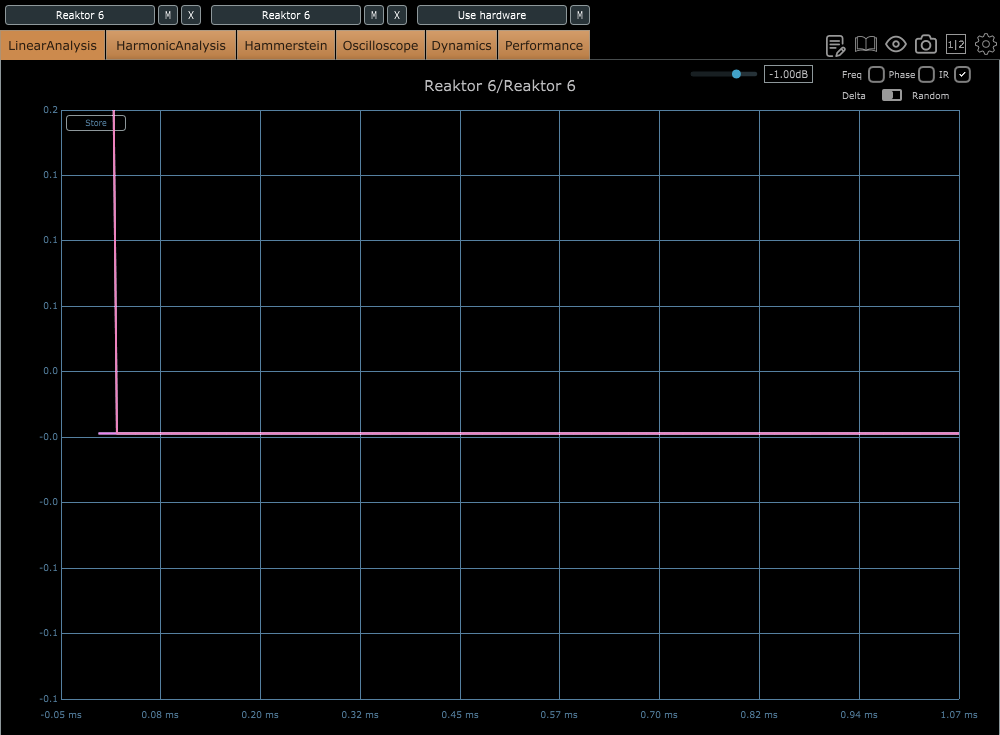
in-out 4x impulse (notice pre-ring in the filtering and the time shift). A filter without pre-ring would give you ringing only to the right (after) the peak which is what you get when filtering manually at 1x (previous pic)
phase in-out 1x
phase inout with the previews lopass
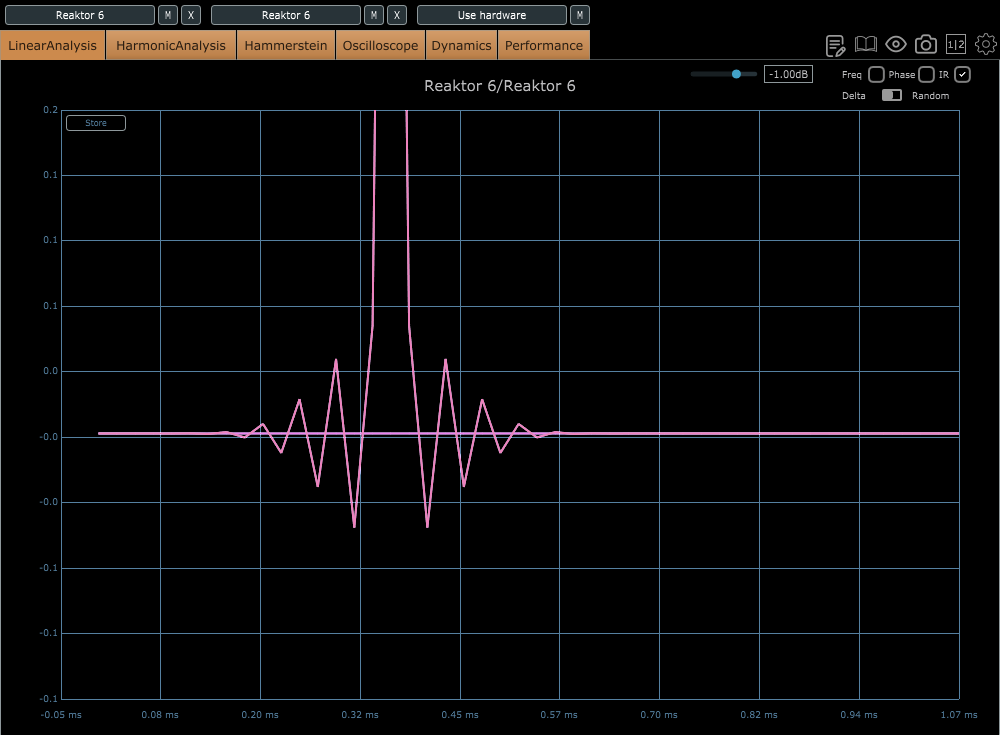
phase in-out 4x with NI upsampling
Other VST minimum phase 4x
same other vst, Linear phase 4x
:)
Your third image looks like some sort of windowed sinc function
https://ccrma.stanford.edu/~jos/pasp/Theory_Ideal_Bandlimited_Interpolation.html
oh, ok... i see what you're saying.. it definitely looks like a linear phase impulse response.... and that should make the phase response linear... LOL. that's weird. i think you would need someone at NI who knows the backend to get an answer? because i certainly don't know what to make of that
thank you :) great link!
I see a linear-phase kernel:
A symmetric or antisymmetric kernel is always linear-phase.
shouldn't the phase plot not look like this then, in that case?
hmm, I though the same, but is that just what linear looks like when plotted on a log graph?
linear != constant?
is that just what linear looks like when plotted on a log graph?
LOL 😅
There it is.
pretty sure linear phase is supposed to look like this
so just to be clear, this is a logical paradox and a proper mystery we have here, correct?
Nope, that would be phase delay, which is -phase/w (with w=2pi*f/sr). Linear phase is a phase that is a linear function of frequency. In this case it's something that unwraps to -16w. We know that because it's a 31-sample symmetric kernel, so it has 16 samples of phase delay. Group delay, which is the minus derivative of phase with respect to w, would be 16 too.
What you want with linear phase is a filter that moves all frequencies by the same time, in seconds, samples, etc. Constant phase is not constant time: a whole 100 hz cycle is longer than a whole 10 khz cycle. You want to delay high frequencies by more cycles than low frequencies to have them all delayed by the same time. More precisely, an amount of cycles proportional (linear) to frequency.
this is very painful because its all well over my head and thus i don't know where to start with the proper questions.
when you say
Nope, that would be phase delay
you mean this measurement?
and if so, the above plot would be what one would expect from a linear phase filter?
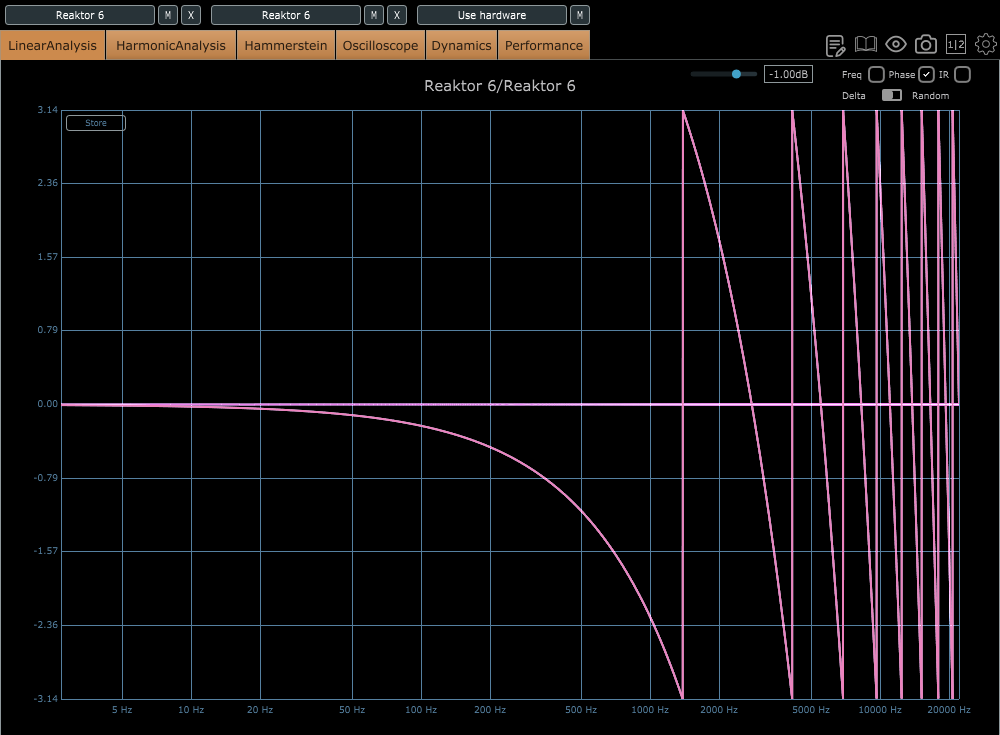
and if so, does that mean that this next plot, shown below, would be indicative of something else?
i see you added this part:
which helps clear it up. i guess the remaing confusion would just be wondering what would be the difference between those two plots: if the top one was typical for a linear phase filter, what would the bottom one be?
If there is latency/delay then ideally all phases should have the same time delay - if not, then there will phase cancellation etc.
higher frequencies take less time per cycle, and phase is measured in cycles, so we get that zigzag phase wrap as the phase per frequency rises in order to maintain a constant time delay. (I'm just properly grokking this properly myself in this context :) it's something I've kind of understood, but in a roundabout complexified* way, instead of the razor sharp simplicity of it - thanks Laureano)
The straight horizontal line is what you get when there is no time delay/latency - in that case, the phase doesn't need to change.
If there is a phase shift that is constant with frequency, surely there would be all sorts of horrible/cool phasing artefacts? like with a bode frequency shifter?
Maybe the 'problem' here is the 'other vst' is either not oversampling, or some settings are wrong on the analysis tool? Maybe the other vst has been intentionally set to have a constant phase shift, and has that option specifically in order to generate those phasing artefacts? or for some other technical process? or bugs!
*I'm amazed and delighted that complexified turned out to actually be a real bona fide word - yay!
No, I meant that what is constant (like, a flat line) for a linear phase system is phase delay, not phase. Phase is the argument of the Fourier transform, which corresponds to a position in the sinusoid's cycle. Phase is linear for a linear phase system, it's a linear function of frequency.
the above plot would be what one would expect from a linear phase filter?
In a log plot it's hard to discern. In a linear plot you see those lines are indeed straight diagonals. If they happen to get curvy somewhere, the system is not linear phase.
this next plot, shown below, would be indicative of something else?
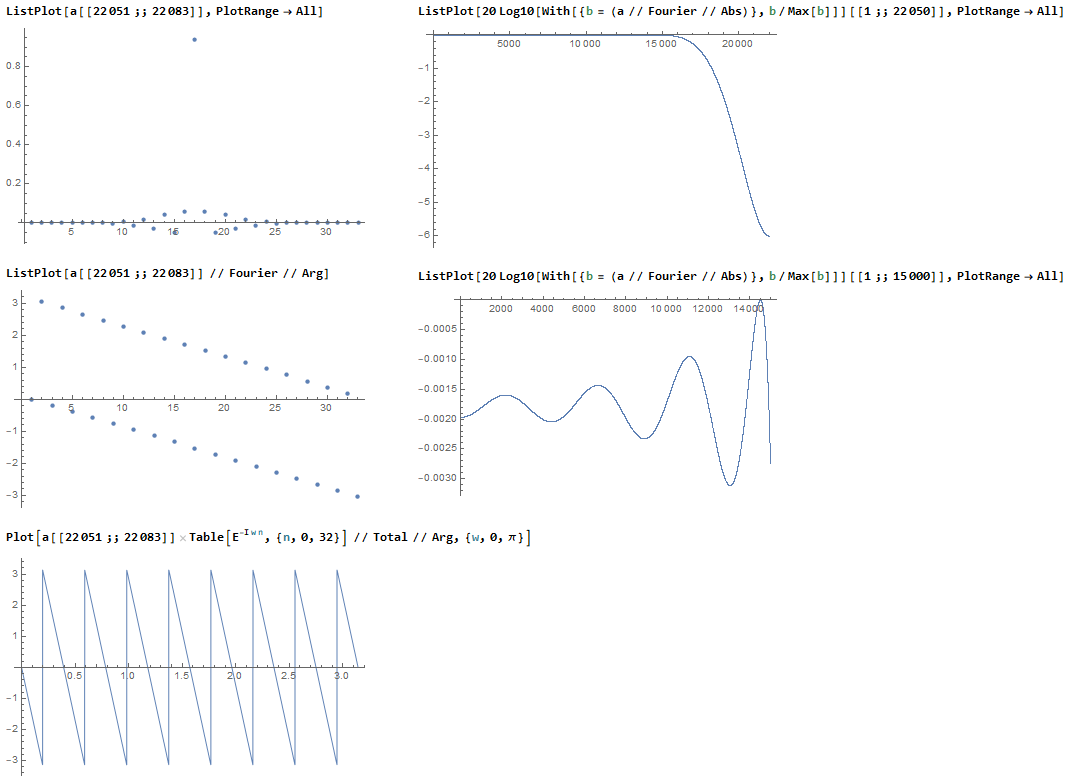
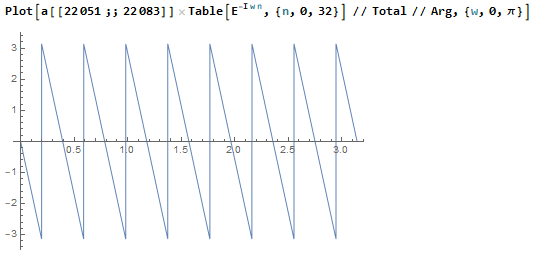
It would indicate that the system does nothing with phase. I would say that excludes all things we normally call filters, but theoretically you can speak of zero-phase filters. That would be any (symmetric) linear-phase kernel which is shifted to have its center at time zero. It would be zero-phase because the kernel is in-phase at its center. Remember my phase plot before:
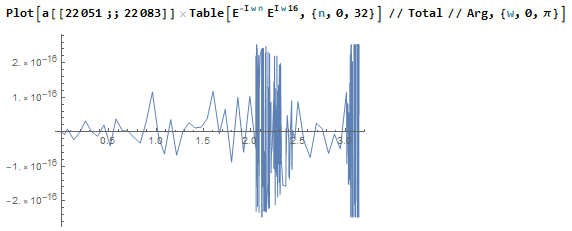
The function has terms of e^-iwn, or z^-n, with n from 0 to 32. So z^0, z^-1, ...z^-32. If I multiply all terms by z^16 (that is, I shift the whole kernel by 16 samples, to get z^16, ...z^0, ...z^-16), the phase response is
noise around zero. What does it mean? Well, it's merely a change of viewpoint. Instead of starting to filter right now, I start to filter 16 samples in the past. Therefore, at time zero I'm in-phase. But I can't start doing things in the past: a zero-phase filter is non-causal. The viewpoint makes sense for an offline render: if you apply latency compensation to a linear-phase filter so that the output stays aligned with the input instead of being shifted n samples forward, you could say your filter has been "zero-phase". It was in the result, but not in the process -you just shifted the whole thing back afterwards.
So, a possible answer to our riddle may be that we're measuring the change from input to output, and other plugins are latency-compensating their oversampling filters, while Reaktor is not.